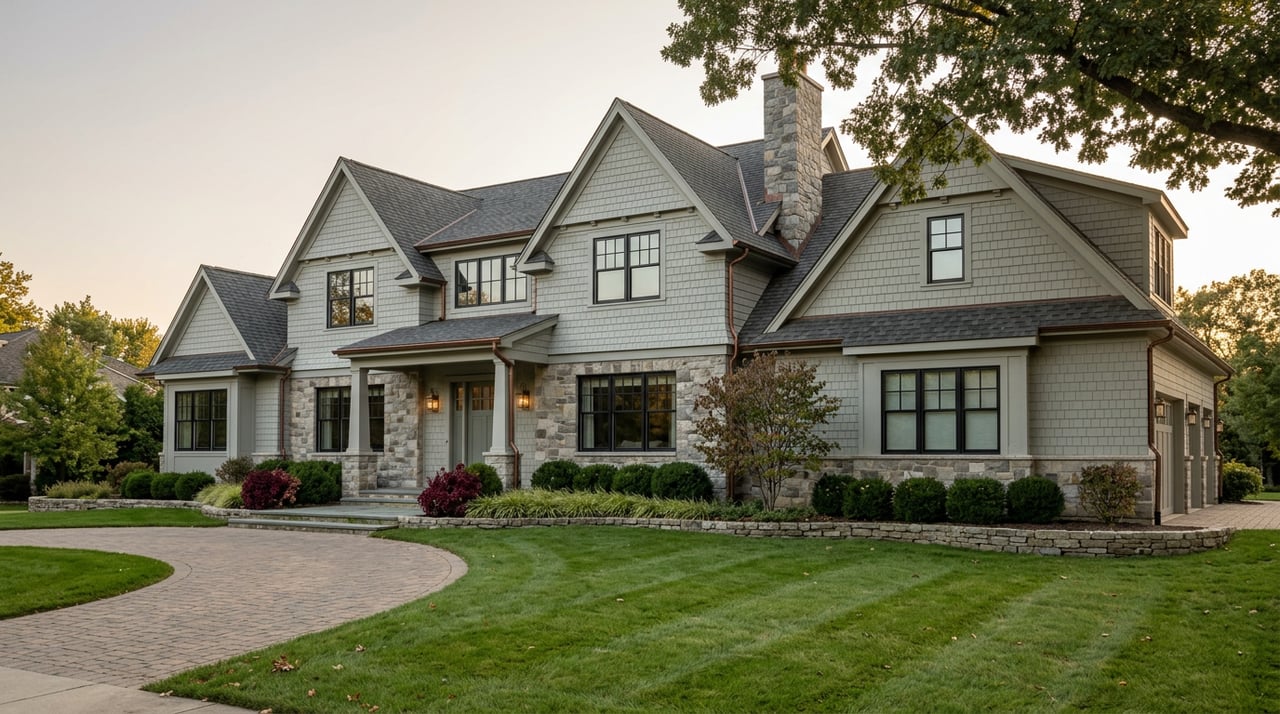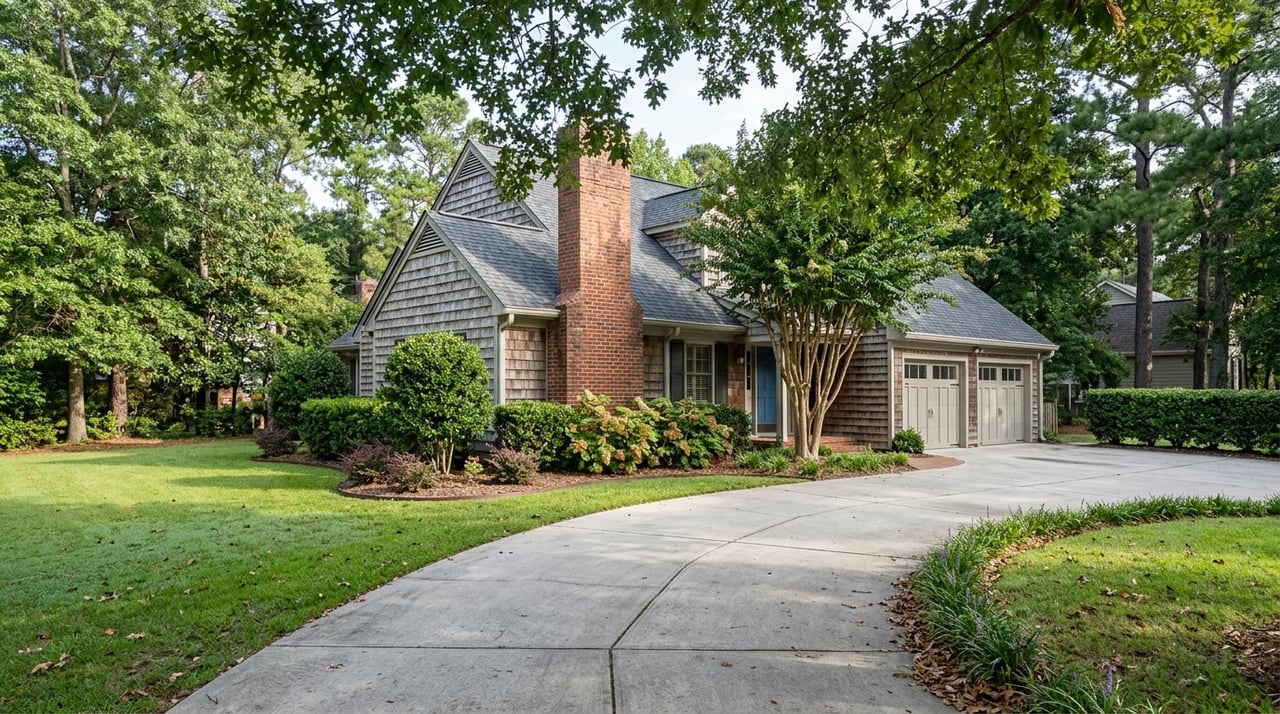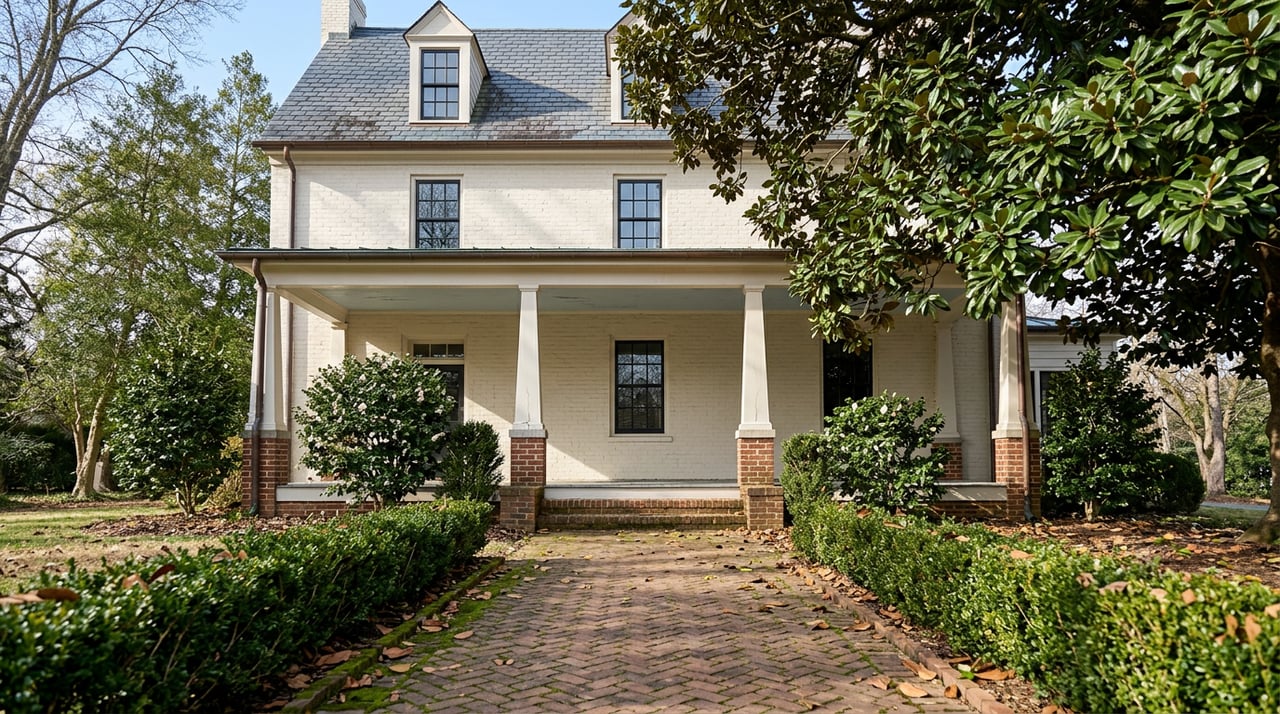
In the three months ending June 2026, homes that closed on Augusta Road landed at a median price of $917,131. A few miles north, in North Main, the median for the same stretch of time came in at roughly $915,000. Two thousand dollars apart. If you only glanced at those two numbers, you'd assume Greenville's two most prestigious addresses are moving in lockstep.
They are not. Augusta Road's median fell 20.2 percent from the year before. North Main's rose 10.5 percent. One number went down, the other went up, and they landed within shouting distance of each other anyway. That is not a coincidence worth shrugging off. It is the whole story of how to read a Greenville neighborhood price in 2026, and it applies whether you are buying, selling, or just trying to figure out what a listing agent's comp sheet actually means.
The City Number That Doesn't Answer the Question
Zoom out first, because the citywide figure is the one every portal leads with and the one that explains the least. Over the three months ending June 2026, the median sale price across the city of Greenville sat at about $525,000, up a flat 0.3 percent from a year earlier. Meanwhile the median price per square foot rose 13.5 percent, to $319. Homes sold in June climbed to 309, up from 268 the prior June. Days on market stretched to 59, up from 47.
Put those together and you get a market that looks calm on the surface: prices basically flat, more homes trading, a little more patience required. That description is true for the city in aggregate and useless for anyone deciding between two specific streets. Greenville County's own housing analysis, reported in early September, pegged the income needed to afford a median-priced home in the county at $90,000 a year, a threshold that has climbed sharply as 30-year mortgage rates pushed to 6.71 percent as of September 3, according to Freddie Mac's weekly survey. That affordability squeeze is real and it is countywide. It tells a buyer almost nothing about whether Augusta Road is a bargain right now or North Main is overheated.
Same Price, Opposite Mechanics
Here is where the two headline neighborhoods split apart. Augusta Road's median dropped 20.2 percent year over year, but the number of homes that actually closed there rose 41.3 percent over the same three months, and price per square foot fell only 3.5 percent. That combination only makes sense one way: more homes traded, and the ones that traded skewed smaller and less expensive than the crop that sold a year earlier. The street itself did not get 20 percent cheaper. The mix of what happened to close during those ninety days shifted toward smaller footprints, which drags the median down without repricing a single existing home on the street.
North Main tells the opposite story with a similar-looking number. Its median rose 10.5 percent, and its price per square foot rose 27.3 percent over the same window. That is not a mix shift. That is buyers paying meaningfully more for the same amount of house, closing after closing. North Main got more expensive in a way you would actually feel if you owned property there or were trying to buy in.
Two neighborhoods can post nearly identical median prices and be telling you the exact opposite thing about where values are headed. The median alone cannot distinguish "smaller homes traded" from "the same homes cost more." You need price per square foot and sales volume sitting next to it before the number means anything.
The Month That Undid the Three-Month Story
If that were the end of it, you could walk away with a tidy rule: check price per square foot alongside the median, always. But Augusta Road has one more twist worth knowing before you trust any single data pull.
A snapshot of the same Augusta Street Area taken in August 2026, a single month rather than a three-month rolling window, shows a median sale price of $1,162,439, up 29.2 percent year over year. That is not a typo and it is not a different neighborhood. It is the same handful of blocks, measured a couple of months later, telling a story that directly contradicts the "down 20 percent" figure from the spring quarter.
Both numbers are accurate for the window they cover. Neither is wrong. What they reveal together is that Augusta Road trades in low enough volume that a single month's closings, sometimes a dozen homes, can swing the median by tens of percentage points in either direction without anything about the neighborhood's actual desirability changing. If your agent hands you one month's Augusta Road number and calls it the trend, ask which window it covers and how many sales it is built on. A prestige address with thin transaction volume is exactly the kind of place where the median is the least trustworthy number in the report, even though it is the number everyone quotes first.
Where the Median Actually Behaves Itself
Not every Greenville neighborhood has this problem, and knowing which ones don't is useful information on its own. The city's higher-volume, more liquid submarkets produce medians that move in smaller, more predictable steps because enough homes trade every quarter to smooth out any one unusual sale.
- Taylors, over the same three-month window, posted a median of $314,829, one of the more affordable and stable readings in the metro.
- Greer came in even lower, at $309,831, with enough transaction volume that its number does not swing on a handful of closings.
- Five Forks sat at $479,739, comfortably below the city median while still reflecting a genuinely active suburban market.
- Overbrook, over the trailing twelve months through spring 2026, closed at a median near $445,000, up about 2 percent, with homes typically spending around six weeks on the market before going under contract.
- West Greenville is the one exception that proves the rule from the other direction: its median jumped 36.9 percent over the same three months while price per square foot fell 31.4 percent, a divergence that only shows up when very few homes are trading in a small creative district built on mill renovations and gallery lofts. Treat that number as directional, not a verdict on the neighborhood's trajectory.
The pattern holds across nearly every comparison. Where volume is high, the median tells you something real. Where volume is thin, whether that is a $900,000 historic street or a small arts district still finding its footing, the median needs a second data point before you act on it.
What This Means If You're Comparing Neighborhoods Right Now
If you are weighing Greenville submarkets against each other, a few habits will save you from reading a headline number the wrong way.
- Ask for price per square foot alongside any median you're quoted, especially in Augusta Road, North Main, or West Greenville. The gap between the two tells you whether you're looking at a genuine price move or a shift in what kind of home happened to sell.
- Ask how many homes the number is based on. A median built on 12 closings behaves very differently than one built on 300.
- Ask which window the figure covers. A three-month rolling median and a single month's snapshot can tell opposite stories about the same street, as Augusta Road just demonstrated.
- Weight your confidence by liquidity. In Taylors, Greer, Five Forks, and Overbrook, the median is doing real work. In the city's thinnest, highest-value pockets, it is doing less than it looks like.
None of this means Augusta Road or North Main are risky places to buy. Underlying demand for Greenville, driven by a metro population that grew 9.3 percent between 2020 and 2025 to top a million residents, has not gone anywhere. It means the number on the listing sheet needs a second look before it changes your offer.
If you are trying to figure out what a specific Greenville address is actually worth right now, and how much confidence to put in the comps a portal is showing you, that is exactly the kind of question worth running past someone who pulls this data every week. Michael Dassel can run the real comps for your street, not just the neighborhood-wide average, and tell you whether the number you're looking at is one you can trust. Request a free home valuation and get the version of this data built for your address, not the whole zip code.